Following arXiv:2607.25507, this report examines whether phase-derived features improve endpoint prediction over a combined baseline in two settings: a sealed contradiction comparison and a retrospective analysis of answer changes across matched pressure prompts. Study 1 froze a contradiction-category pipeline before sealed scoring. On 1,136 eligible primary cases, adding PC-2 produced a paired AUROC difference of +0.00087. The 99% bias-corrected accelerated interval included zero, and the prespecified +0.05 threshold was not met. A replication role with 1,063 cases showed a same-direction increment of +0.00019. The replication-direction condition passed, but both primary conditions failed, so advancement failed. Study 2 developed fifteen treatments on blocks b0-b4 using 1,415 eligible answer-change comparisons and twenty-repeat, five-fold grouped cross-validation. An execution on 9 September 2026 recomputed development statistics from saved prediction units and applied a three-condition gate; no treatment advanced. Layer 25 had the only positive mean-repeat PC-2 increment, approximately +0.00027, with a favorable sign in three of five seed blocks. These statistics measure development consistency, not whole-seed-block holdout performance. Agreement with earlier selection records does not establish an earlier notebook execution or that the rule was fixed before inspecting development results. The planned b5 selection and b6 evaluation were not completed through this gate. Neither study demonstrated the incremental benefit required by its applied advancement rule. The findings limit support for the evaluated feature constructions; they do not test the rotary score identity, its local pre-softmax bound, or the effectiveness of execution-boundary governance.

This fully synthetic study tests a structure-preserving surrogate on NRTL-generated phase equilibrium systems; it contains no experimental molecular validation. A symmetric neural potential represents GE/(nRT), from which activity coefficients, thermal derivatives, binodals, flashes, and tangent-plane-distance diagnost...
P. Robles, Luis Rios-Colque, Vanesa Bazán et al.· International Journal of Mol...· 0 citations
A post-hoc transform fitted on held-out data and applied separately to each system is repurpose classical monotone calibration as a symmetric audit: a post-hoc transform fitted on held-out data and applied separately to each system.
Md Tanveer Hossain Munim, Bijoy Ahmed Saiem, Al-Amin Sany et al.· arXiv.org· 0 citations
MARC-TS, a two-stage framework that learns a continuous, endpoint-conditioned path, queries it at any resolution and uses local path context to refine a transition-state candidate, is introduced.
The RMF benchmark contains 3,000 resolved binary questions across nine domains, and results show why forecasting scores should be interpreted alongside simple probability baselines and question composition: under this protocol, newer versions or higher model tiers do not consistently produce more accurate probabilities...
Symbolic regression combines structural search with numerical fitting, but aggregate fit scores do not describe how the remaining error varies across inputs. We introduce RISR, a residual-informed method that uses these error patterns to guide formula discovery and learn which corrections are worth fitting. A residual...
Hao-Bo Li, Wen-Shuo Zhang, Wen-Xiao Zhao et al.· 0 citations
Can a token’s collapse be predicted from design parameters fixed at launch, before it has market history? We compile on-chain data for 155 tokens (79 survived, 76 collapsed) and benchmark seven classifiers under leave-one-out cross-validation. Random Forest attains the highest area under the curve (AUC; 0.909; nested c...
Jesús Gil Ruiz, Rafael Muñoz Gil, Diego Rubén Rodríguez Regadera· Journal of Risk and Financia...· 0 citations
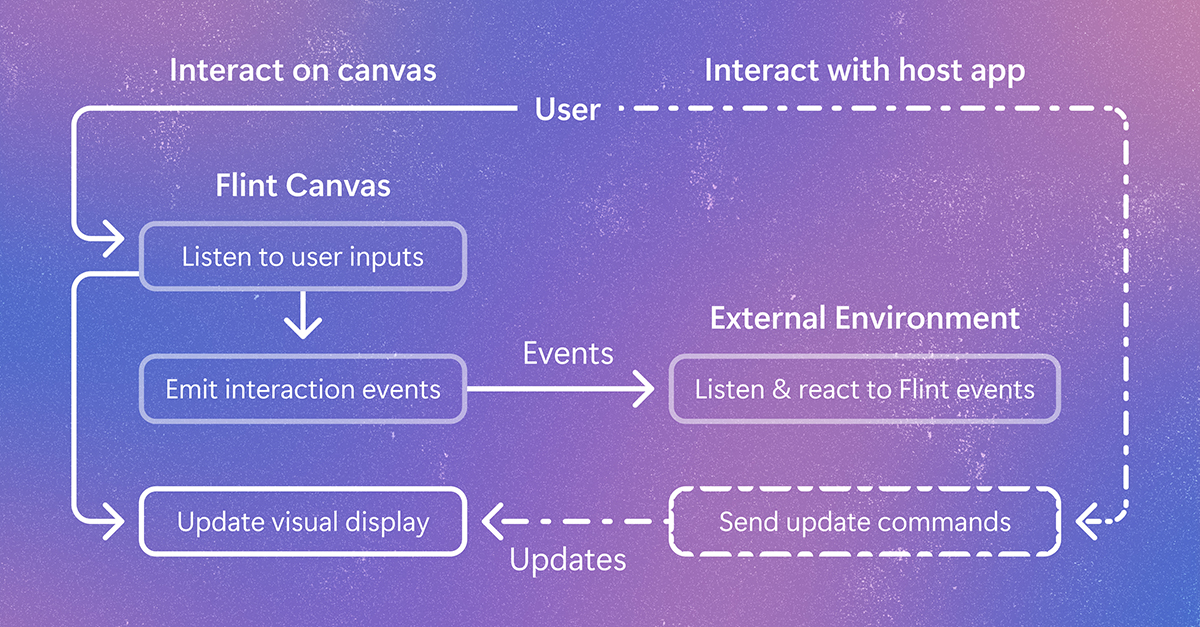
Flint-interactive gives AI agents a language for creating interactive visualizations. Click a chart, filter data, highlight related content, and explore beyond the view the author originally chose. The post Flint-interactive: A language for creating interactive data visualizations appeared first on Microsoft Research.