Completeness and Cost of Retrieval Structures for Multi-Tool Requests in LLM Agents
Shuyang Zhang
Nov 2026
Natural Language Processing
Abstract
An agent that must call several tools to fulfill a request fails when the tool retriever omits any one of them, yet tool retrievers are mostly built and evaluated on queries requiring a single tool. We compare representatives of six retrieval structures (flat lexical and dense retrieval, LLM query decomposition, LLM-navigated hierarchies, server-then-tool matching, dependency graphs, and trained set-level retrievers) across two multi-tool testbeds: 345 AppWorld queries with expert dependency labels and 103 MCP-Bench tasks over 257 MCP tools. We measure completeness@k, the share of queries whose entire required tool set appears in the top k, alongside the LLM calls, tokens, and latency that each structure incurs at retrieval time. A motivating analysis on all 7,961 ToolRet queries shows that aggregate completeness mixes two regimes: completeness at 10 is .58 to .67 on single-target queries and .08 to .17 on queries with four or more targets, and the ordering of retrievers on single-target queries reverses on multi-target ones. Across the two testbeds, none of the compared structures that is untrained on the testbed and makes at most one LLM call per query completes more than 10% of AppWorld queries at k = 16. The two structures that do better incur different costs: a set-level retriever trained on 75 to 90 in-domain queries reaches .33 on AppWorld and .58 on MCP-Bench with no LLM calls, while an LLM-navigated hierarchy reaches .30 and .40 with a median of 31 to 38 LLM calls and about five minutes per query. Their failure modes also differ: the trained retriever mostly ranks the missing tools just below the cutoff, whereas the hierarchy finds the target API and stops before collecting its prerequisites. In a downstream check with the official AppWorld agent, tasks with a complete retrieved set succeeded 21 of 21 times, whereas incomplete ones succeeded 2 of 39 times.

This publication proposes a definition and a classification of agile software development approaches and analyses ten software development methods that can be characterized as being "agile" against the defined criterion.
P. Abrahamsson, O. Salo, Jussi Ronkainen et al.· arXiv.org· 727 citations· ⚡54
Consequences of happiness and unhappiness that are beneficial and detrimental for developers' mental well-being, the software development process, and the produced artifacts are found.
D. Graziotin, Fabian Fagerholm, Xiaofeng Wang et al.· Journal of Systems and Softw...· 236 citations· ⚡13
The Mobile-D approach is briefly outlined here and the experiences gained from four case studies are discussed, which helped develop an agile development approach for mobile application development.
P. Abrahamsson, Antti Hanhineva, H. Hulkko et al.· Conference on Object-Oriente...· 225 citations· ⚡18
GAOKAO-Bench is introduced, an intuitive benchmark that employs questions from the Chinese GAOKAO examination as test samples, including both subjective and objective questions that contribute a robust evaluation benchmark for future large language models and offers valuable insights into the advantages and limitations...
Xiaotian Zhang, Chun-yan Li, Yi Zong et al.· arXiv.org· 216 citations· ⚡17
A study with 42 participants investigates the relationship between the affective states, creativity, and analytical problem-solving skills of software developers and offers support for the claim that happy developers are indeed better problem solvers in terms of their analytical abilities.
D. Graziotin, Xiaofeng Wang, P. Abrahamsson· PeerJ· 216 citations· ⚡13
This state-of-practice investigation was performed using a literature review followed by a multiple-case study approach and presents how inconsistency between managerial strategies and execution can lead to failure by means of a behavioral framework.
Carmine Giardino, Xiaofeng Wang, P. Abrahamsson· International Conference on...· 175 citations· ⚡19
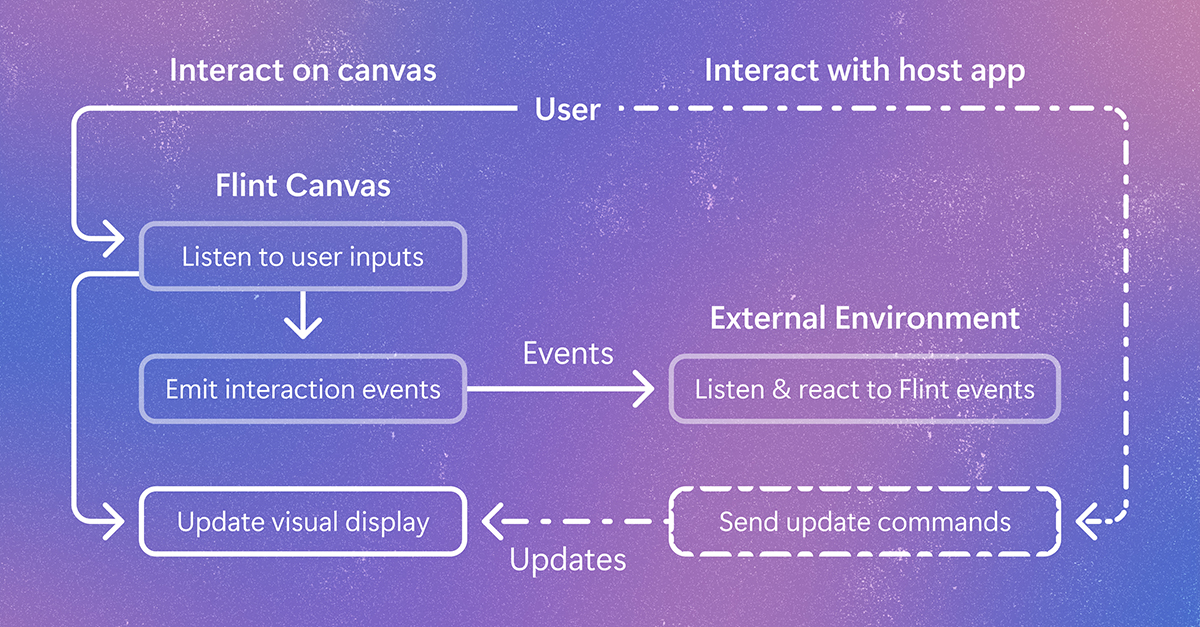
Flint-interactive gives AI agents a language for creating interactive visualizations. Click a chart, filter data, highlight related content, and explore beyond the view the author originally chose. The post Flint-interactive: A language for creating interactive data visualizations appeared first on Microsoft Research.